Preparing Clinical Research Data for Analysis: From Messy Excel Files to Clear Reports
Have the Research Data, but Still Struggling with the Spreadsheets?

Collecting research data takes time. But once the data is in Excel, another job often begins.
The data is a bit messy. Formats differ from entry to entry, categories and dates don’t always match, and you’ll find some duplicates and missing values along the way.
For medical and clinical researchers, sorting out these issues can take hours. It can also take time away from reviewing findings, writing reports and moving the research forward.
Having the data is one thing. Getting it ready for analysis is another.
The Challenge: Small Data Issues Can Create Extra Work
Even a large dataset can become difficult to manage when information is not organised in a consistent way.
You’ve probably seen it before. the same category may appear under different names. Dates may use different formats, and some numerical fields may contain errors or incomplete entries. In other cases, several pieces of information may have been entered into one column.
These issues can make it harder to review the dataset, prepare summaries and produce clear research reports.
Trying to check everything manually can be slow and frustrating, especially when the dataset contains hundreds or thousands of records.
The Right Approach: Clean, Organise and Prepare the Data

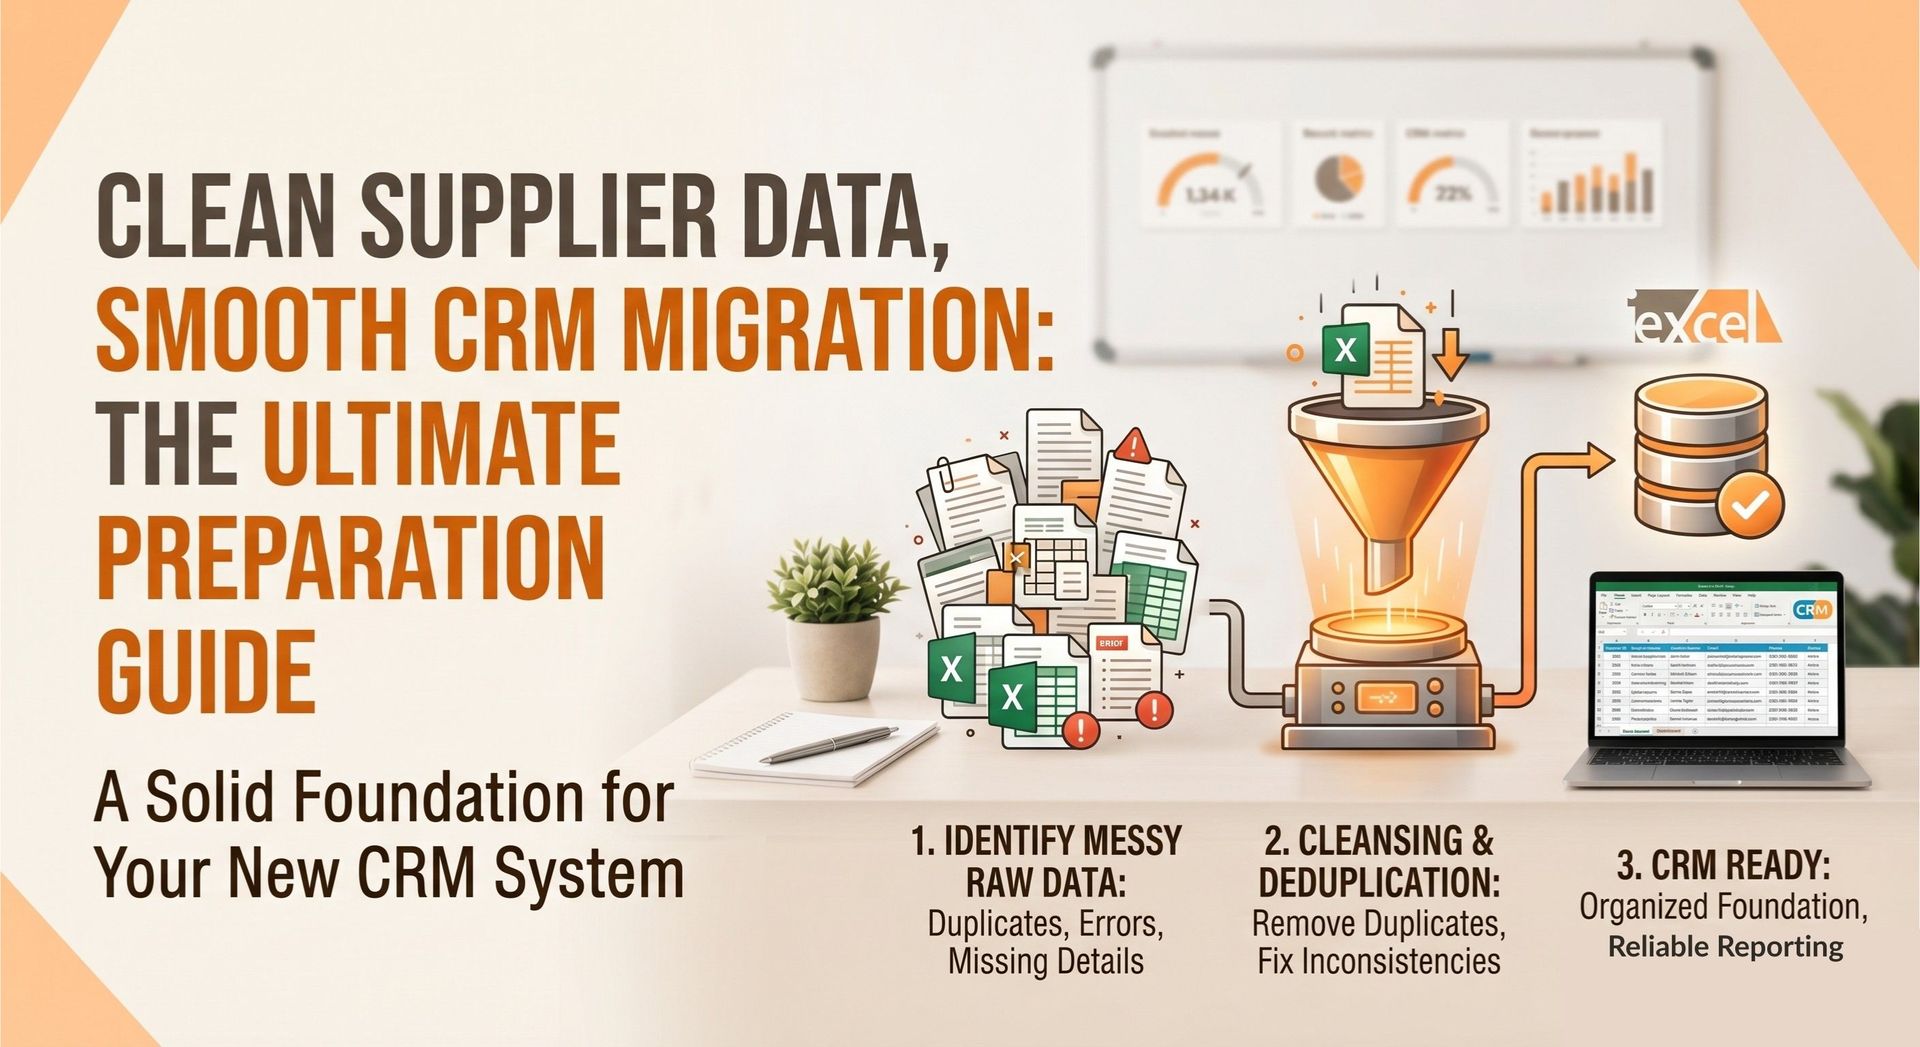
Start by reviewing your dataset so you know what needs fixing before the analysis begins. This is where iExcel can help.
iExcel uses Excel-based cleaning and preparation methods to help researchers with things like:
- Finding duplicate records and inconsistent entries.
- Making categories and formats consistent.
- Checking missing or incomplete values.
- Reviewing dates and numerical fields.
- Organising variables into a clear structure.
- Applying agreed coding rules and preparing derived fields where needed.
- Creating clear Excel workbooks that are easier to use.
The aim is not to change research findings. It is to make the dataset more organised and easier for the research team to work with.
From Spreadsheets to Clear Tables and Figures
Getting your data clean is a great start, but it’s not the whole job. Researchers also need to share their findings in a way that’s clear and easy to understand.
iExcel can help prepare:
- Descriptive and summary tables.
- Charts and graphs.
- Research figures.
- Supplementary tables.
- Consistently formatted Excel outputs.
These outputs can support research reports, presentations, manuscripts and other study documents.
The Result: Less Time Fixing Spreadsheets

A tidy dataset gives researchers their time back, with less checking of formats, less sorting of entries and no need to start every table from nothing.
Information becomes easier to review. Data-quality issues are easier to identify, and reports can be prepared in a more consistent format.
This doesn’t replace statistical analysis or specialist advice. For advanced methods, work with a qualified statistician or biostatistician.
Confidentiality Comes First
Research information must be handled with care. New Zealand's Privacy Act 2020 and Health Information Privacy Code 2020 set important requirements for the handling of identifiable health information.
Before any data is transferred, iExcel will discuss the project’s data-handling requirements and agree on a process. Sharing only goes ahead once permissions, confidentiality, privacy and security measures are all in place.
Need Help With a Research Dataset?
Whether it is one large Excel workbook or several files that need to be brought into a consistent format, iExcel can provide practical support with
data cleaning, organisation, preparation and presentation.
Have a research dataset that needs attention? Talk to iExcel about your Excel and data preparation requirements.
Frequently Asked Questions
1. How do I clean a large clinical research dataset in Excel?
Start by checking for duplicate records, missing values, inconsistent categories, date formats and numerical errors. Then organise the variables and apply agreed coding rules before preparing the data for analysis.
2. Can Excel handle large research datasets?
Yes. Excel can manage many research datasets, depending on their size and complexity. Tools such as Power Query can also help clean, combine and organise information more efficiently.
3. Can iExcel perform statistical analysis for clinical research?
iExcel focuses on Excel support, data cleaning, preparation, summaries, tables and figures. For advanced statistical methods or specialist biostatistical advice, researchers should work with a qualified statistician or biostatistician.